What the building needs, costed and scheduled.

We cost what is overdue at the effective date, and forecast what falls due over the next five years.

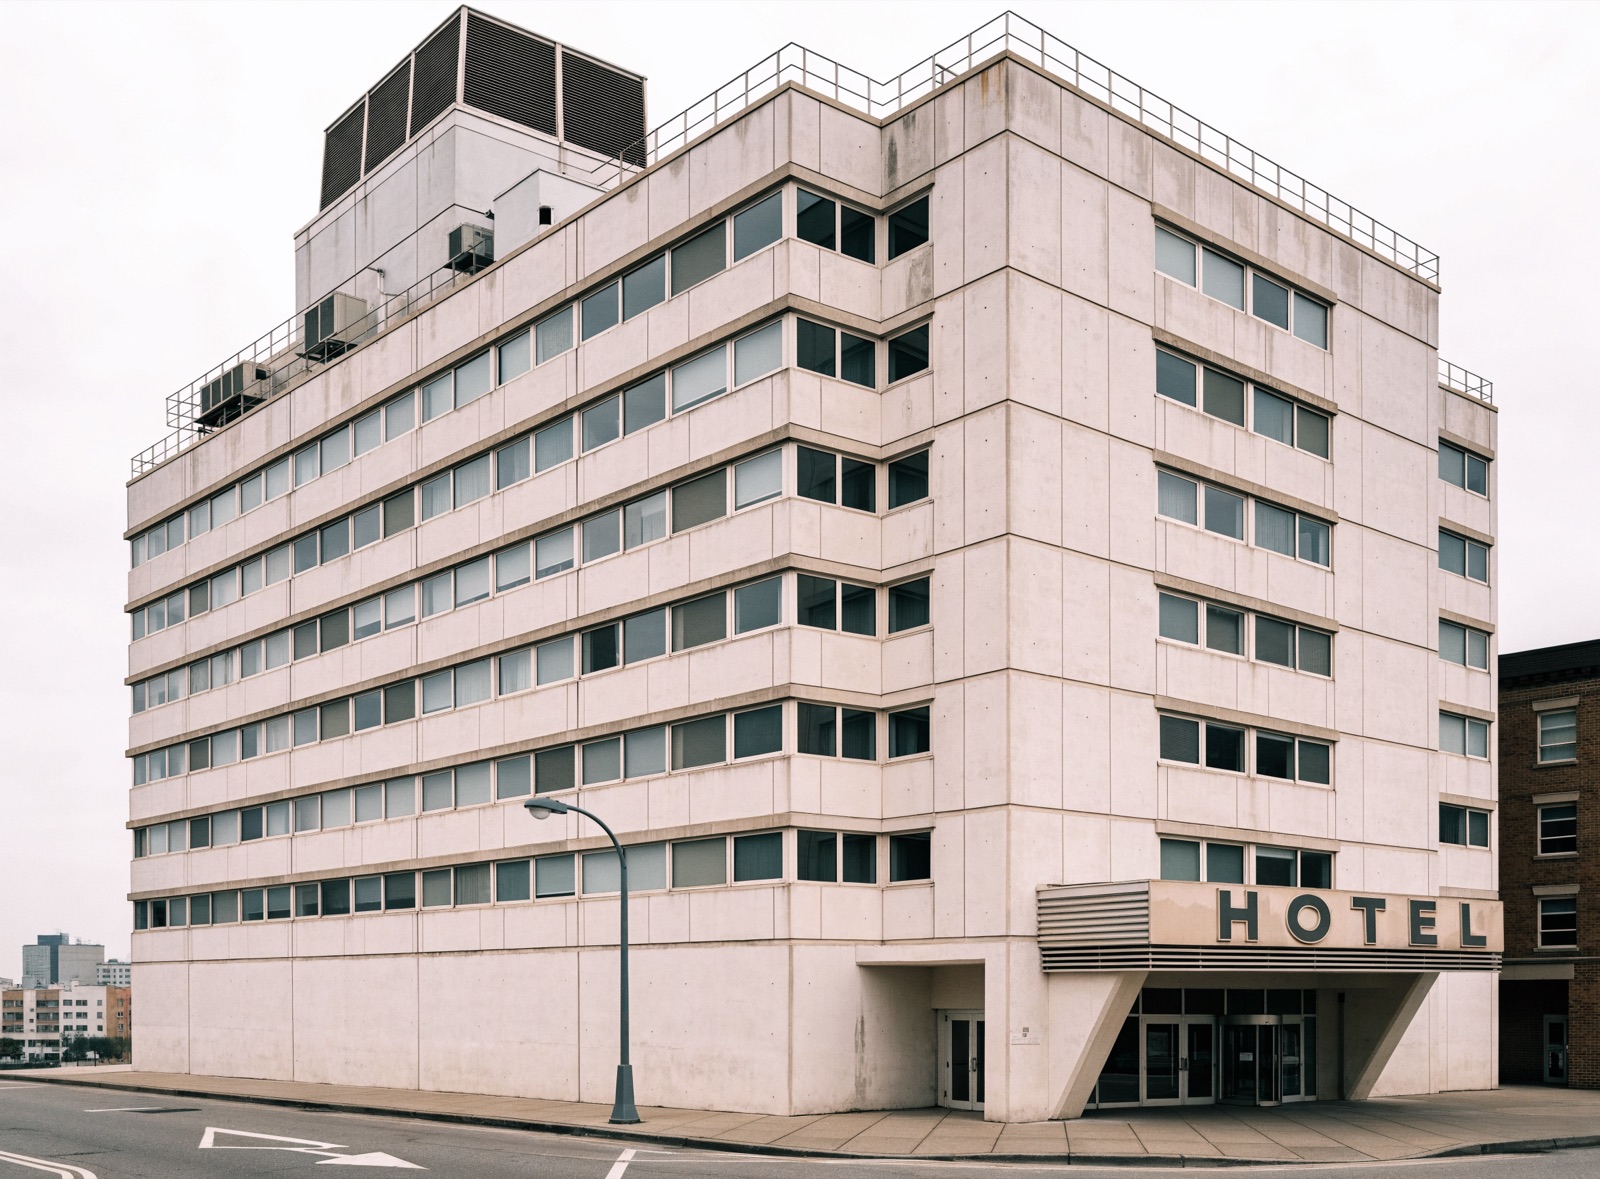
An operating mid-century full-service hotel in precast concrete, with a rooftop cooling tower, staining below the parapet and original ribbon glazing.
Cooling tower at 18 of 25 years. Sealant past cycle

$1,496,700

Deferred maintenance at the effective date, at cost to cure

$227,460

Excess over cost new, for removal, disposal and occupied-building rework

$2,980,300

Depreciation on short-lived components not yet due

12

Components at or approaching the end of their useful life

Illustrative, 184-key full-service hotel. Method follows standard breakdown practice.

Two schedules. One is a bill, the other is a forecast.

What is already overdue is estimated at what it takes to fix now, rather than what it cost to build. What is not yet due gets measured against its own useful life. Every line resolves to a unit rate and a quantity, so any of it can be checked or changed.

Schedule A. Deferred maintenance, due at the effective date Illustrative, 184-key full-service hotel
Unit rates are modelled from industry norms with a local cost multiplier applied. Cost to cure is what it costs to correct the item today, including removal, disposal and working around occupancy. Cost new is the same item in original construction. Deferred maintenance is the Cost to Cure column. Cost New is not a second estimate of it: it is the amount removed from replacement cost new so these items are not depreciated twice.
Item Basis Cost to Cure Cost New Excess
Guestroom Soft Goods62 keys past cycle$11,500 / key$713,000$607,600$105,400
Corridor Carpet and WallcoveringFloors 3 to 7, 14,000 sq ft$18.50 / sq ft$259,000$213,500$45,500
Elevator No. 2Controller failure, car out of service$184,000 / car$184,000$161,000$23,000
PTAC Units48 failed at inspection$2,850 / unit$136,800$112,320$24,480
Roof, North Field Section9,200 sq ft, active leaks$14.75 / sq ft$135,700$115,920$19,780
Exterior Sealant and Flashing3,100 linear ft$22.00 / lin ft$68,200$58,900$9,300
Total deferred maintenance, at cost to cure17.9% premiumDeferred maintenance$1,496,700$1,269,240$227,460

The gap between the two columns is the part most condition reports leave out. Correcting an item in an occupied hotel costs more than installing it new: you pay to remove and dispose of what is there, you work at night and floor by floor, and you lose elevator capacity while you do it. That premium is a real cost and it belongs in the number.

Schedule B. Short-lived components, not yet due Age over useful life
Components still in service at the effective date, depreciated on their own replacement cycle. Each becomes deferred maintenance when it reaches the end of that cycle.
Component Age / Life Consumed Depreciation Amount
Elevator Cars 1 and 3Modernization overdue21 / 2521 of 25 years. $530,00084.0%$530,000
Guestroom Soft GoodsRemaining 122 keys5 / 75 of 7 years. $1,048,60071.4%$1,048,600
HVAC, PTAC and Boiler PlantOriginal equipment14 / 2014 of 20 years. $596,40070.0%$596,400
Kitchen and Food Service EquipmentLine, walk-ins, dish9 / 159 of 15 years. $312,00060.0%$312,000
Corridor FinishesFloors 8 to 124 / 104 of 10 years. $268,00040.0%$268,000
Roof, Main FieldReplaced 20242 / 302 of 30 years. $225,3006.7%$225,300
Total, short-lived depreciation$2,980,300

Figures illustrative. Quantities come from the client’s own property data; unit rates and component lives come from published norms adjusted by a local multiplier; condition comes from the inspection and is never modelled.

Three ways a building sheds value.

Depreciation is not one number. It resolves into three categories, each measured on different evidence and each standing on its own. A report that collapses them into a single percentage cannot be checked, and cannot be corrected.

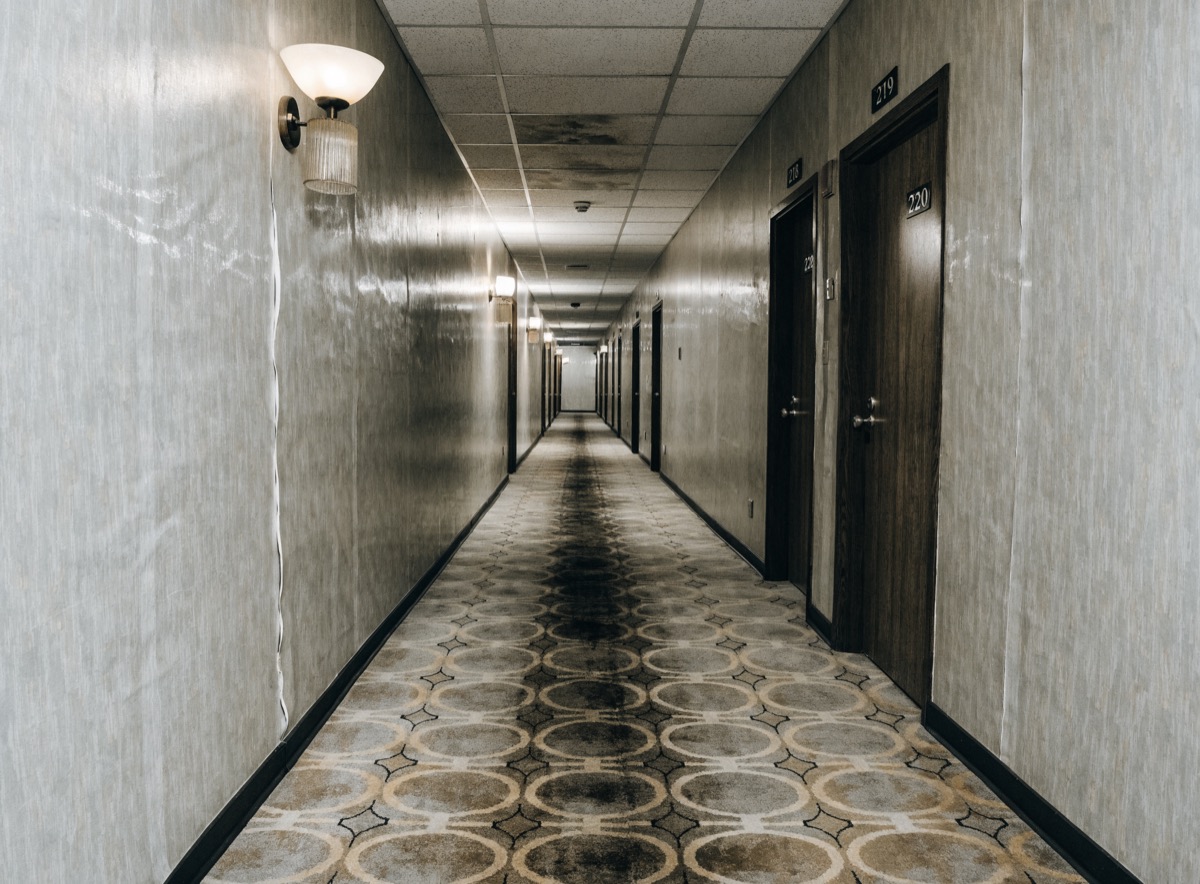
Hotel corridor with traffic-lane soiling on patterned carpet and seam separation in the vinyl wallcovering.
Physical

Deterioration

Wear from age and use. Split between what should have been repaired already, what will need replacing before the building's economic life ends, and what lasts as long as the structure.

  • Curable, deferred maintenance

    Items needing immediate repair or replacement to meet functional standards and appeal to buyers. Measured at cost to cure, which can exceed the original installation cost once removal, disposal and unexpected complications are priced in.

  • Incurable, short-lived

    Components not yet due for replacement at the effective date, but which will need replacing before the building reaches the end of its economic life. Partially depreciated using an age over life ratio applied to current cost.

  • Incurable, long-lived

    Everything that is neither deferred maintenance nor short-lived. Exterior walls, structural framing. Assumed to share the building's age and life expectancy and not to require replacement within its economic life. Takes the effective age over total economic life ratio applied to residual replacement cost.

Functional

Obsolescence

The asset is intact but wrong for its market. Keys undersized, no rough-ins for the amenity guests now expect, or a feature that cost money and earns nothing back.

  • Deficiency requiring addition

    The property is missing an improvement common in comparable buildings, so the cost to cure exceeds reproduction cost new. Curing it means an addition or retrofit, and retrofitting is almost always dearer than installing during construction. The difference is the loss.

  • Modernization or substitution

    A component is outdated relative to the market at the effective date. Take the cost of the existing component, deduct physical deterioration already counted and any salvage value, add removal cost and the cost to install the replacement. The excess is the cost to cure the deficiency.

  • Superadequacy

    Components that exceed what the market expects and do not return contributory value equal to their cost. Deduct the physical deterioration already applied from the current reproduction cost of the excess portion, then add the net cost to cure. Only curable if removal actually adds value or reduces cost.

External

Obsolescence

Nothing is wrong with the asset. The loss arrives from outside it: a supply wave, a corridor in decline, a neighbouring use that moves rate.

  • Capitalization of income loss

    Convert the income the external factor costs you into a loss in value. Permanent losses are capitalized at the cap rate or a gross income multiplier; temporary losses go through a discounted cash flow so the timing is reflected.

  • Paired sales analysis

    Compare similar properties where the only meaningful difference is exposure to the negative external influence. The spread is the value loss. Vacant land sales can be analysed separately to split the effect between land and building.

  • Allocation of extracted depreciation

    Extract a lump-sum depreciation figure from market data, then allocate it across the three categories. The residual after physical and functional is the external component.

A number that comes apart line by line.

A single depreciation percentage tells you nothing you can act on. A component schedule does: every line carries a unit rate, a quantity and a life, so you can see what drives the total and change any assumption inside it. The breakdown method is what produces that.

A

BreakdownApplied

Observed condition. Every component isolated, costed, and depreciated on its own life. Slowest to produce, and the only one that shows its working.

B

Economic Age-Life

Effective age over total economic life, applied to the improvement as a whole. Used for site improvements and as a cross-check.

C

Market Extraction

Depreciation backed out of comparable sales. Valuable as corroboration, far too blunt to carry the analysis by itself.

One line item, worked

Corridor carpet and wallcovering, floors 3 to 714,000 sq ft
remove and dispose existing, at $2.85$39,900
carpet supply and install, at $12.40$173,600
wallcovering, 4,900 sq ft at $6.20$30,380
night shift and floor-by-floor phasing$15,120
Cost to cure$259,000

Cost new, removed from RCNCost to cure, the deferred maintenance

Condition is measured to a date, not to a visit.

Every ratio in the report keys off a stated effective date. A roof at two years of thirty on 1 July is a different number from the same roof eighteen months later, and a report that blurs the two is worth nothing to whoever relies on it.

Fix the Effective Date

Set before anything else. Every component is rated as of this date, and it is the rating, not the calendar, that decides which ones are deferred maintenance.

Inspect and Rate

Every major component walked and rated. This is the one input that is never modelled, and it is what the rest of the analysis hangs on.

Quantify and Cost

Quantities from the property record, unit rates from published norms with a local multiplier applied, and a cure premium set by access and occupancy.

Reconcile and Sign

Deferred maintenance at the effective date, the schedule of what follows, and the five-year programme, issued to a named recipient for a stated use.

The Condition Test
Not yet due Effective age 21 of 25 years, 4 remaining. 84.0% consumed. Depreciation $530,000. Deferred maintenance $0.

The inspection rates each component’s condition as of the effective date. Rated at or past the end of its useful life, the component is deferred maintenance, costed at what it takes to fix it now. Rated short of it, it is depreciated by the share of life consumed, and its deferred maintenance is zero.

4 to 6 Weeks from inspection to issue. Engagements are scoped backwards from the date you need the report, not forwards from the date you call.

What it costs to keep the building working.

The two schedules roll forward into a five-year capital programme. Real property and furniture, fixtures and equipment are forecast separately, because they are funded differently and they do not depreciate on the same clock.

Real property capital FF&E reserve
2026/27$2,600,700
2027/28$1,979,100
2028/29$2,077,200
2029/30$2,524,400
2030/31$1,916,600
Five-year total$11,098,000
Real property capital

$5,236,700

Roof, envelope, elevators, mechanical and electrical plant. Year one is the deferred maintenance schedule in full.

FF&E reserve

$5,861,300

Case goods, soft goods, public area and food service equipment. Grown at 3% a year, funded from a reserve rather than a capital request.

Illustrative. A five-year programme is the standard horizon for a reserve study, and the schedules above are what populate year one.

Send us the property. We will tell you what it needs, and when.

Inspection, component costing, and a signed deferred maintenance schedule with a five-year capital outlook.

Request a Scope
Asset classesHotel, commercial, multifamily, industrial
CoverageCanada and the United States
Turnaround4 to 6 weeks from inspection